


Home > Textbooks > Basic Electronics > Inductors > Series LR Circuit >
Inductors
Series LR Circuit
The action of current and voltage in a purely resistive circuit is for all practical purposes instantaneous. In other words, when a switch is closed in a circuit containing only a DC source and a resistor, current and voltage reach a maximum value almost instantaneously.
It has been mentioned previously that inductance affects circuit action only when there is a change in circuit current. It can then be assumed that the technician is primarily concerned with inductance in AC and not steady state DC circuits. This assumption is correct. But since DC current and voltage can increase and decrease in magnitude it is informative to study the effects of the inductor when voltage or current is increasing or decreasing.
Growth Current in Series LR Circuit
All inductors and batteries have some internal resistance. For ease of explanation this resistance can be lumped together or treated as an individual resistor. This process of lumping circuit elements is called idealization. The circuit in the figure below is idealized and consists of a perfect voltage source, perfect switch, perfect inductor, and a resistance which represents the combined inherent resistances of all the elements.
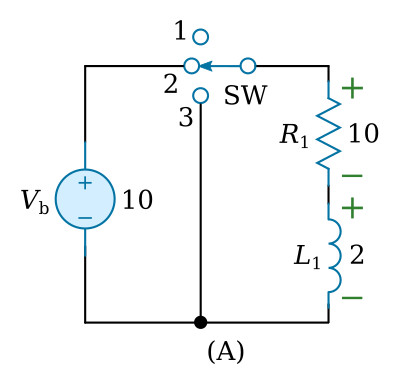
It has been stated that inductance is the property of a conductor that opposes an increase or decrease in current. Using the circuit and waveforms of the figure above, a voltage and current analysis of the series RL circuit will now be made.
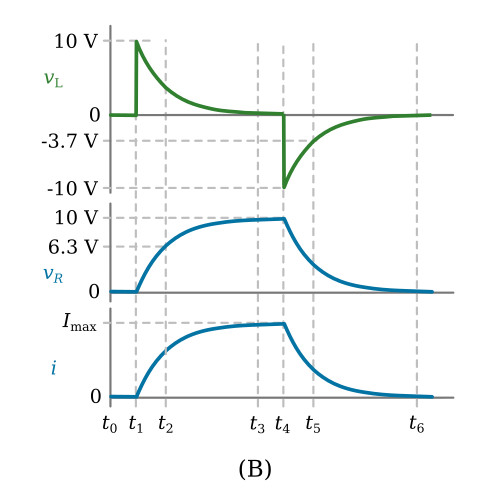
At time zero (t0) the switch (SW) would be in the number one (1) position. As can be seen the circuit is open. The waveforms in the figure above, view (B) show that at (t0) there is no voltage across the coil (vL is zero), there is no voltage across the resistor (vR is zero), and there is no current flowing (i is zero).
The waveforms showing the above conditions remain unchanged until time one (t1). At t1 the switch is thrown to the number two (2) position. At this instant the current will attempt to increase to its maximum Ohm's law value, in this case:


The current attempts to attain a value of one amp (1 A) in zero elapsed time. Thus, the current is undergoing its maximum rate of change (roc) at this instant (t1). At the exact instant (t1), there is a simultaneous displacement of electrons in all parts of the circuit, and while this displacement is immeasurable as a current flow, it does cause the coil to produce a back EMF which is almost equal to the EMF of the source (Vb). An inspection of the waveforms (figure above, view B) will show the above statements in a graphical form. At t1, vL (back EMF) has increased to nearly the source value, vR shows no measurable voltage drop, and i shows no measurable amount of current flow. A brief instant of time after t1, current flow starts and a measurable drop occurs across R. As part of the source voltage is now dropped across the resistor, less voltage is applied to the coil. As a result, a decrease of back EMF occurs which permits an increase of current.
Going back to t1, it was mentioned that the rate of change of current (roc) was maximum. This can be proven by computing the rate of change of current at various instants of time as follows:

Note: This roc only applies at the exact instant of time (t1).
As the current increases, the vR drop increases, and the induced voltage of the coil decreases. In fact, examination of the vR waveform indicates that at time two (t2) vR has increased to about 6.3 volts. According to Kirchhoff's law for voltage the sum of the voltage drops (vL + vR) must equal Vb. Therefore, vL must equal Vb - vR. At t2 then:
![]()
substituting approximate values from waveforms:
![]()
The approximate roc at t2 may now be found:

From the above it can be seen that as time increases the roc decreases. As time increases more voltage is dropped across the resistor and less across the inductor. Since:

it follows that Δi / Δt decreases with time.
The action of the circuit is continued up to time three (t3). It can now be seen from the waveforms that vL has decreased to nearly zero, vR is now nearly equal to the source voltage, and the circuit current has just about reached maximum. Close inspection of the waveform shows that at t3:

Actually the current will never reach the maximum value of 1 A. After a predictable length of time however, the magnitude of the current is so close to its theoretical maximum value it can be considered to have reached this value. This final point is reached in the figure above (view B) very shortly after t3. After t3 a steady state value is established by the current, and since for all practical purposes there is no more change, there is effectively no more back EMF being produced. The energy taken to overcome the back EMF of the coil is now stored in the magnetic field which exists around the coil.
As long as the switch is maintained in position (2) the conditions of the circuit will remain as follows: vL equals to zero, vR equals the voltage source and i is equal to its maximum Ohm's law value.
Decay Current in Series LR Circuit
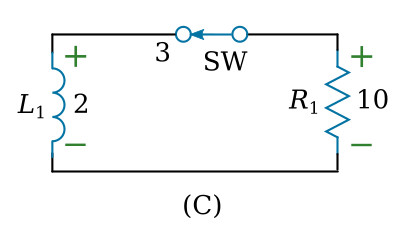
At time four (t4) the switch (SW) is moved instantaneously to position (3). Since the source Vb is now removed from the circuit the current will attempt to stop instantly. Again the term attempt has been used because of the action of the inductor in opposing any change. At t4 the waveform depicts the coil as developing a large back EMF, only this time the polarity is in the opposite direction because the back EMF is developed by the collapsing of the magnetic field. At t4 the circuit of the figure above (view A) consists of a basic circuit with the resistance connected across the coil, which is now acting as the source of voltage. The equivalent circuit during decay time is shown in the figure above, view C. Current through the resistance is maintained in the original direction due to the action of the collapsing flux field.
The waveforms in the figure above (view B) indicate that at the instant of time t4 the coil (acting as the source), is supplying maximum current (i at t4 is 1 A) and the circuit satisfied Kirchhoff's voltage law. (The voltage drop, vR = 10 V, is equal to the source, vL = 10 V.) The energy originally supplied to the coil is stored in the field surrounding the coil, and as the field collapses more and more of this energy is returned to the circuit. The less energy the field contains, the less rapidly it will collapse, and the less rapidly it collapses the less back EMF will be produced.
The action of the circuit during decay is shown more clearly by the waveforms. It can be seen that at t5 the field has expended a large part of its stored energy. The coil voltage vL (absolute value) has decreased to a value of approximately 3.7 V. To satisfy Kirchhoff's voltage law the resistive voltage drop vR must also have decreased to 3.7 V which in turn indicates a decrease in circuit current. Since current will only be maintained during the time the field is collapsing, the waveforms indicate the above circuit action will continue until t6, when for all practical purposes the field has completely collapsed. This time vL has decreased to zero, vR has decreased to zero, and i has decreased to zero. It will be noted that the waveforms of resistor's voltage and circuit current are identical and therefore, in some graphs, may be illustrated by the same curve.
LR Time Constant
It was stated, during the explanation of roc, that the current would reach its maximum value in a certain predictable length of time. Specifically, the time it takes the current in a circuit, containing only resistance and inductance to increase to 63.2 percent (or decrease to 36.8 percent) of its maximum value is known as the time constant. The time constant is determined by the ratio of circuit inductance to circuit resistance. The mathematical equation is:

where: τ (tau) - time constant in seconds, L - circuit inductance in henrys, R - circuit resistance in ohms
Example. Find the time constant of a circuit in which the inductance is 2 H and the resistance is 10 Ω.

The current in an LR circuit does not rise in a linear manner. The instantaneous current magnitude with respect to time follows what is called an exponential curve.
The exponential curve is a result of the fact that a current, in approaching a maximum value in a series of time constant, will only increase 63.2 percent of the remaining value in each time constant. In other words, if the final maximum value of current in a circuit is to be 1 A, then the first time constant the current will increase to 63.2 percent of 1 A or 0.632 A. During the second time constant the change in current will be 63.2 % of the difference between the final value and the value at the end of the first time constant:
![]()
According to the explanation of the exponential curve and the definition of a time constant, the current will increase 63.2 percent of the remaining value during the second time constant. This will be 63.2 percent of 0.368 A or approximately 0.233 A.
Therefore, at the end of the two time constants the current, in its rise toward maximum, will have a value equal to the current increase in the second time constant or:
![]()
Following the above procedure again the remaining value of current will be:
![]()
63.2 percent of this value, the amount or rise in current during the third time constant, is:
![]()
At the end of the third time constant the current will equal:
![]()
In the above calculations the increase of current in each succeeding time constant is seen to be less and less. For normal applications, after five time constants have passed the current differs from its final value by such a negligible amount that it is considered to have reached its final value.
Universal Time Constant Chart
Since the growth and decay of current in any LR circuit follows the exponential curve, a curve developed for a specific circuit can be made to apply to any LR circuit by merely changing the values of time and current.
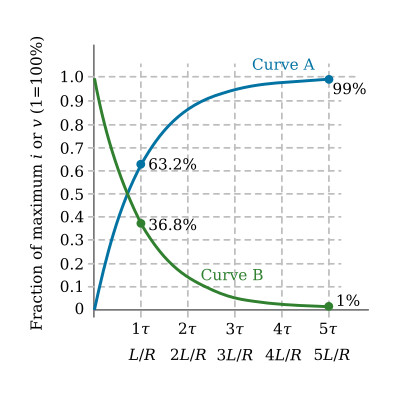
The chart above presents the magnitude of voltage and current in a series LR circuit of any integral time constant during growth and decay. The curve A represents inductor growth current or resistor voltage during growth of inductor current. The curve B represents inductor current during decay, inductor voltage during inductor current growth, and resistor voltage during decay of inductor current.
The curve representing the growth current in a series LR circuit is a graph of the general exponential formula given below:
![]()
where:
i - instantaneous current in amps
Imax - maximum value of current in amps
e - the base of natural logarithms, (rounded off to 2.718)
τ - time constant (L/R) in seconds
t - elapsed time in seconds
This equation is just one variation of the exponential formula used in LR circuits. Other variations are listed below for convenience:
Equations for LR circuits during current growth:
![]()
![]()
where:
Vb - source voltage in volts
vR - instantaneous resistor voltage in volts
vL - instantaneous coil voltage in volts
All other factors as defined previously.
Equations for LR circuits during current decay:
![]()
![]()
![]()
where:
Is - circuit current at start of decay, in amps
R - circuit resistance, in ohms
All other factors as defined previously.


