


Home > Textbooks > Basic Electronics > Operational Amplifiers > Frequency Response >
Operational Amplifiers
Frequency Response
The open-loop gain of an operational amplifier varies with frequency. It can be high at low frequencies but decreases rapidly above some frequency which is characteristic of the particular amplifier. At high signal speeds, there is also a limit on the maximum rate of change of the output voltage. This limit is called the slewing-rate limit. These real amplifier characteristics are considered in the next sections.
The amplitude-response and phase-response curves for a typical operational amplifier are given in the figure below. The low-frequency gain of the amplifier is 100 dB, or 100,000, and the low-frequency phase shift is essentially zero. At some frequency (often below 10 Hz as in this case) the gain begins to fall off, usually at 6 dB per octave. A slope of 6 dB per octave is used because it provides the basis for stability when feedback is applied properly; this comes about because the maximum phase shift is about -90° for all gains from 100 to 0 dB (105 to 1). Negative feedback means that there is an additional -180° of phase shift outside the amplifier, and so the maximum phase shift for all usable gains is -(180 + 90) = -270°. Since it takes 360° of phase shift (input and output in phase) for an instability in the form of oscillations to occur, a 6-dB-per-octave-slope operational amplifier will be stable if negative feedback is applied properly.
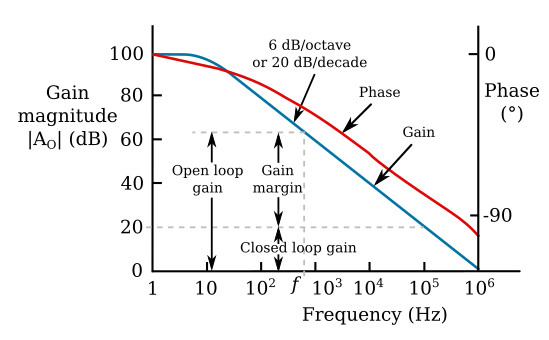
A very important indicator of operational amplifier performance can be extracted from the figure above by inspection, namely, the gain margin for a particular application. First note that the gain without feedback is called the open-loop gain, while the gain achieved by the application of feedback is called the closed-loop gain. The gain margin is the difference in gain between the open-loop and closed-loop gains. The open-loop and closed-loop gains and gain margin for an amplifier with a closed-loop gain of 20 dB (× 10) are shown at some frequency f in the figure above. The significance of gain margin is as follows: The gain of an operational amplifier circuit depends solely on the external feedback elements and not on its internal transistors and resistors as long as there is adequate gain margin. For example, for the 20 dB gain closed-loop plot shown in the figure above, the gain margin varies with frequency as follows:

For most applications of operational amplifiers, a gain margin of 40 dB is sufficient, but even 20 dB is often adequate, depending on accuracy requirements. If 40 dB of gain margin is needed with a closed-loop gain of 20 dB, an amplifier having the response shown in the figure above can be used only up to 1 kHz, while if 20 dB is satisfactory, then the frequency can be extended to 10 kHz.
The following example illustrates the effect of finite bandwidth on the voltage follower.
Example: Find the magnitude of the gain at 100 kHz of a voltage follower that uses the operational amplifier for which the frequency response is plotted in the figure above.
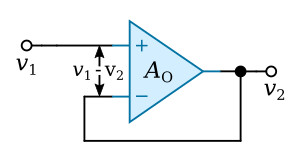
Solution: Referring to the figure above, the follower has an input voltage v1, an output voltage v2 and an open-loop gain of AO (it is nonideal in this respect). The output voltage is equal to the voltage difference between the input terminals of the amplifier times AO, or
![]()
Rearranging this equation gives the closed-loop gain AC,

If AO is infinity, as with an ideal operational amplifier, then the closed-loop gain AC = 1. In this example, however, |AO| = 20 dB or 10 at 100 kHz. It is not correct to substitute |AO| = 10 into the previous equation because an incorrect answer of 0.9091 will be obtained, which is more than nine percent lower than the ideal gain of one.
In the region where the gain is falling off at 6 dB per octave, AO is a phasor quantity and must be substituted as such into the previous equation. The curve in the amplitude response graph is a plot of the magnitude of AO or |AO|; accordingly,
![]()
For this example, assume θ is nearly -90°, also, |AO| = 10, so that
![]()
Substituting AO from the previous equation into the equation AC = 1/(1+1/AO) gives

The magnitude of AC is then
![]()
which is only about one-half percent below the ideal value of one.


