


Home > Textbooks > Basic Electronics > Filters > Plots of Filter Responses >
Filters
Plots of Filter Responses
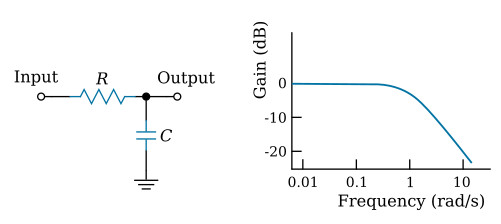
The performance of filters can be depicted in a number of ways; for example, by plotting frequency versus amplitude or phase angle. The most common graphical representation is a plot of amplitude versus frequency (for example, see the figure below). A peculiarity of the scales used for attenuation (gain) and frequency is worth noting: Although the units of attenuation are dB, a logarithmic quantity, the values are spaced linearly along the vertical axis; on the other hand, frequency is not converted to a logarithmic equivalent before plotting, but the graph paper is logarithmically divided along its horizontal axis, and thus frequency is plotted logarithmically. Accordingly, a logarithmic quantity is plotted linearly along the vertical axis and a linear quantity is plotted logarithmically along the horizontal axis. Amplitude-versus-frequency curves nearly always are plotted this way.
In the design of filters, special emphasis is placed on the attenuation slope, which is a measure of the steepness of the attenuation curve in the transition between passband and stopband. The attenuation slope is usually expressed in dB per octave or dB per decade. An octave, which is a term originating in music, represents a factor of two in frequency; accordingly, 10 kHz is one octave above 5 kHz, and 2.5 kHz is an octave below 5 kHz. A decade represents a factor of 10 in similar manner. The relationship between dB-per-octave and dB-per-decade is systematic; for example:
6 dB per octave = 20 dB per decade
12 dB per octave = 40 dB per decade
18 dB per octave = 60 dB per decade
24 dB per octave = 80 dB per decade
30 dB per octave = 100 dB per decade
The relationship is simple because a decade on logarithmic graph paper is 3.3219 times as much distance as an octave so that, for a straight-line attenuation curve, 6 dB per octave (more accurately 6.0206 dB per octave) is equal to (6.0206 × 3.3219) = 20 dB per decade.


